
Turning Data Into Impactful Stories for Bank of America
I partnered with Bank of America to bring clarity and creativity to three key initiatives:
Mobile Trends Report – Visualizing America's smartphone dependence
Small Business Report - Turning complex survey data into clear, engaging reports and infographics
Corporate Narrative – Designing internal docs around mission & responsibility
Better Money Habits – Creating financial literacy content for millennials
CORPORATE BRANDING / SOCIAL ENGAGEMENT / ENTERPRISE COMMUNICATIONS
INFOGRAPHIC / SOCIAL MEDIA GRAPHICS
-
I led creative direction for all graphics, emphasizing adherence to global brand guidelines.
-
Utilizing Adobe Illustrator and InDesign, you ensured the work was on-point and innovative.
-
I learned that following established guidelines can elevate design skills and inspire out-of-the-box thinking.

Mobile Trends Report – Visualizing America's smartphone dependence
Creative Direction
I translated findings from Bank of America’s mobile consumer research into clear, engaging visual stories for social and digital channels. The data highlighted America’s growing smartphone dependence and mobile banking trends.
View full report →
Key Work:
Designed data-driven infographics and assets for social
Helped drive public awareness around mobile banking habits
Made complex stats accessible and shareable


B2B REPORTS
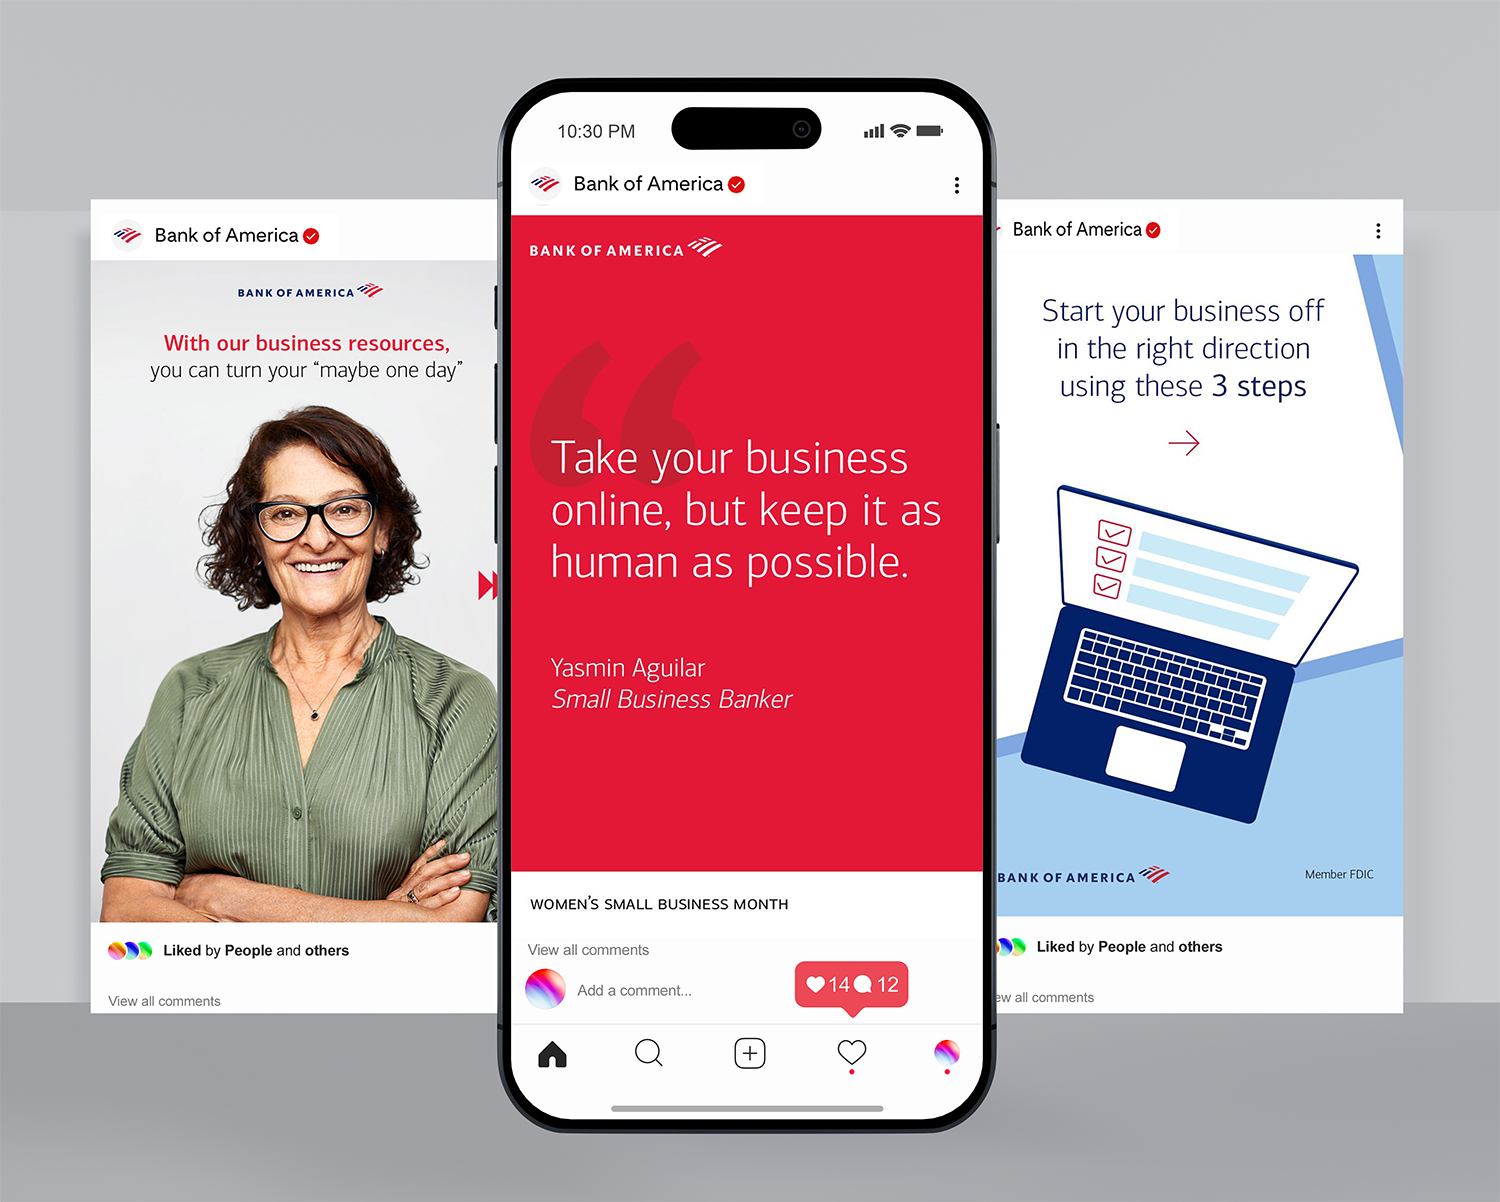
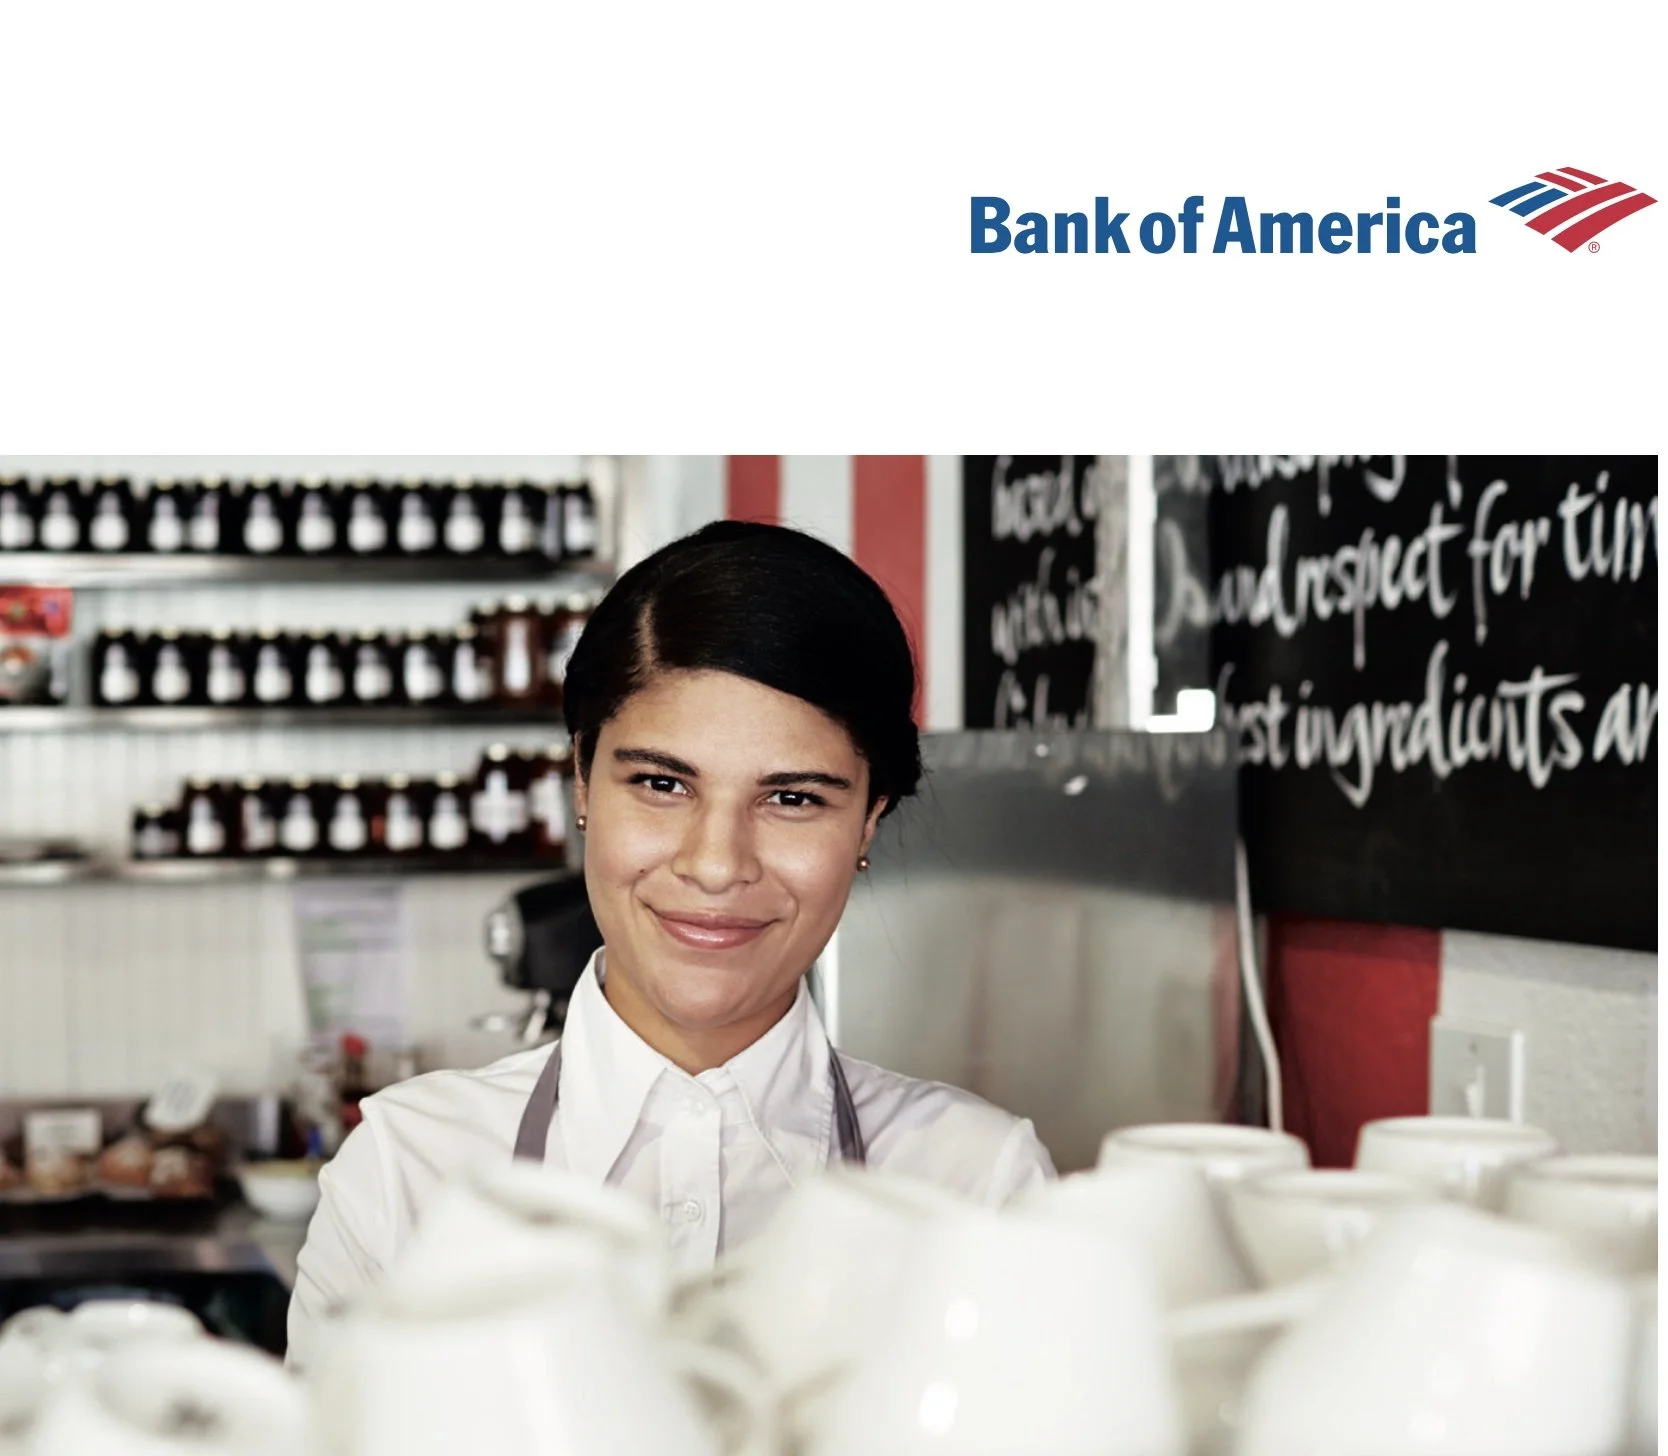
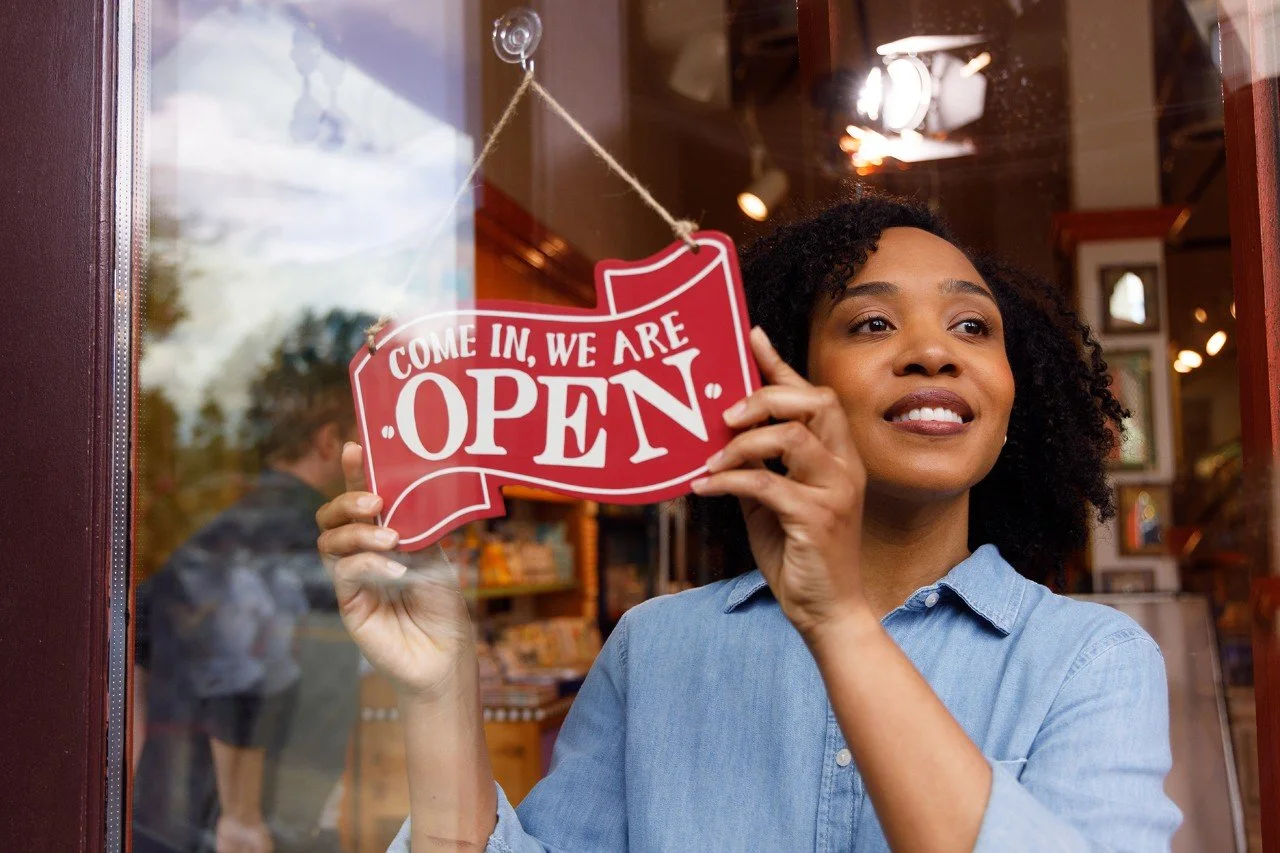
Small Business Owner Report
A nationwide research report transformed into a series of engaging infographics and social-ready visuals that positioned Bank of America as a thought leader for small business insights.
Solution
My Role
Creative Direction & Design: Led the transformation of survey data into visually driven storytelling.
Information Design: Built a clear hierarchy so audiences could quickly understand generational insights, optimism trends, and concerns.
Brand Alignment: Ensured all visuals reflected Bank of America’s corporate identity while modernizing the look with infographics and mobile-friendly extensions.
Approach
Editorial Breakdown
Reviewed the 40-page research report to identify key insights: optimism vs. caution, tech adoption, and funding sources by generation.
Highlighted narrative shifts: Millennials as tech-savvy optimists, Boomers as cautious, Gen-Xers as realistic.
Data Visualization
Created infographic sets that simplified comparisons (e.g., revenue optimism: 78% Millennials vs. 52% Boomers).
Used iconography + color coding to keep information scannable.
Multi-Channel Delivery
Designed print-ready report for stakeholders.
Built shareable infographics optimized for Pinterest and social media — translating the longform report into bite-sized, high-engagement content.
Applied mobile-first layout principles so the research could live on digital platforms.
Challenges
Bank of America needed to distill a complex nationwide survey of 1,000+ small business owners into a compelling, easy-to-share narrative. The report explored generational differences (Millennials, Gen-X, Boomers), concerns about the economy, and adoption of technology. The challenge was to turn raw data into visuals and storytelling that captured optimism, highlighted pain points, and showcased Bank of America as a trusted partner to small businesses.


B2B REPORTS
Corporate Narrative & Social Responsibility
Creative Direction
I supported the rollout of Bank of America’s enterprise-wide narrative, aligning purpose-driven messaging across internal and external channels. The document focused on clarity around values, customer impact, and social commitments.
Key Work:
Designed long-form collateral for enterprise use
Aligned with leadership on messaging around climate, equity, and economic opportunity
Simplified complex topics like overdraft reform and mobile alerts for stakeholder communications


CONSUMER REPORT / SOCIAL MEDIA / INFOGRAPHIC
Better Money Habits Initiative Project: Small Business Owner Report + Millennial Financial Education Campaigns
Creative Direction
As part of the “Better Money Habits” initiative (in partnership with Khan Academy), I designed millennial-focused financial education content. The work spanned insights reporting, infographics, and social assets.
See full report →
Key Work:
Brought financial literacy research to life through charts and storytelling
Produced cohesive social assets tied to key report stats
Helped engage millennial audiences on topics like saving, debt, and parental support

Results
Unified Messaging: Helped Bank of America clarify and align its corporate narrative across internal and external channels, reinforcing values around transparency, inclusion, and social impact.
Higher Engagement on Mobile Trends: Designed social graphics for the Consumer Mobility Report that achieved a 25% higher click-through rate than typical branded posts, making complex data more accessible and engaging.
Expanded Financial Literacy Reach: Better Money Habits content reached over 1 million users, with visual storytelling that boosted understanding of millennial financial behaviors and increased content shareability across digital platforms.
